
Can We Trust Economic Data? Understanding Different Sources for Investment Decisions

Investors who are trying to understand how the economy is doing have been getting mixed messages from recent reports. This confusion even led President Trump to remove the head of the Bureau of Labor Statistics (the government agency that tracks jobs). The most recent jobs report showed weakness and had to correct previous numbers downward, but other reports suggest the economy grew at a good pace in the second quarter. Company earnings continue to do better than expected, pushing stock markets to record highs, while concerns about tariffs and rising prices remain.
These different pieces of information create uncertainty for investors and government officials, making it hard to make smart financial choices when people are questioning the numbers themselves.
The problem isn’t just that different reports are saying different things right now. Understanding how the economy is doing is never as easy as looking at just one or two measures. Learning how to read economic data is essential for making good decisions – this includes information about jobs, rising prices (called inflation), how productive workers are, government spending policies, and much more.
Instead of reacting to single reports, successful investing means knowing how much importance to give each report and looking for bigger patterns over time. In today’s uncertain economic environment, what should investors pay attention to as they manage their investment portfolios and financial plans?
Recent jobs data shows the economy may be weaker than expected
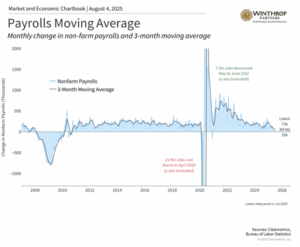
The most recent jobs report caused worry when it showed that only 73,000 jobs were created in July, much lower than what economists expected. On top of that, the government had to make big corrections to the May and June job numbers, showing that there were actually 258,000 fewer jobs than they first reported. This means the economy was much weaker over the past few months than people originally thought.
The size of these corrections has made people worry about whether government numbers can be trusted. This is a problem because government data is what we use to understand economic trends. Whether it’s job numbers from the Bureau of Labor Statistics, economic growth calculations from the Bureau of Economic Analysis, or inflation measures from various government agencies, these statistics guide everything from Federal Reserve policy (decisions about interest rates) to investment choices.
In today’s politically divided environment, whether this data is reliable matters even more. So, it’s important to understand a few key facts about how this data works.
Economic information is the foundation for making investment choices
First, why is this a problem? Some things in life are easy enough to count exactly. For example, the number of workers at one company, the number of people laid off, or the average size of yearly pay raises can all be calculated with almost perfect accuracy. But when it comes to measuring these numbers across tens of millions of companies, or hundreds of millions of people, exact counting is not just hard to do, but may be impossible. This is when statistics and educated guessing are needed.
So, government data sources, like any statistical information, are not perfect. The numbers come from surveys of thousands of businesses and households, done by professional data collectors and analyzed by statisticians and economists. The results are only as good as the surveys and methods used, and should always be viewed as estimates rather than exact measurements.
Second, there is a trade-off between getting information quickly, which investors and policymakers want, and getting precise information, which takes time and more data. Government economic reports are released on strict schedules and then updated multiple times as new information becomes available. This updating process is actually a good thing about the system since it allows for continuous improvement in accuracy. However, it does mean that no single number should be taken as the complete truth.
Despite these limitations, U.S. government data is considered the best in the industry and when compared to other countries. These agencies maintain high standards and serve as the main source for many economic indicators. While their methods can always be improved (and often are), the agencies are staffed by professionals who have worked under many different presidential administrations.
Finally, tension between politics and government data is unavoidable. On one hand, there are strong reasons to want to show the economy in the best light possible. On the other hand, it is difficult to prove whether an economic report is politically motivated. This has been true across many different political environments.
Looking at the bigger economic picture is important
Because of these challenges, it’s important to look at many different perspectives, including both government and private data, to get a clearer understanding of how the economy is doing. In investment research, this is often called “mosaic theory,” or the idea that separate pieces can form a complete picture. Jobs, economic growth, inflation, company earnings, and consumer spending – from different data sources – all provide valuable pieces of the puzzle.
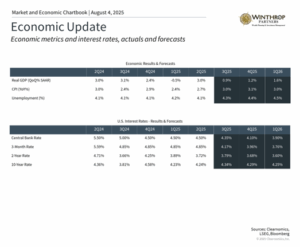
Much of the economics profession involves studying which indicators matter, how much they matter, and when they matter. For example, while the latest employment data is weaker than expected, other data suggests that the economy’s overall output continues to grow at a healthy pace. Second quarter GDP growth (a measure of how much the economy grew) sped up to 3.0%, well above the long-term average, showing a reversal of the trends from the first quarter.
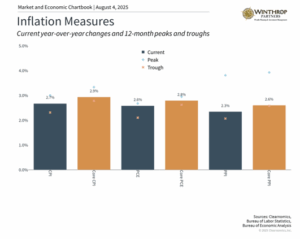
Tariffs (fees on imported goods) remain the unknown factor and are one important reason for mixed views on the economy. Inflation (rising prices) has not yet increased dramatically as some feared, but it does remain stubbornly above the Fed’s 2% target.
Still, there are early signs that tariffs could be affecting consumer prices. According to the latest Consumer Price Index report (a measure of inflation), rising prices for everyday consumer goods are speeding up even as price pressures for services are easing. In addition, the latest Personal Consumption Expenditures numbers (another inflation measure) show that inflation sped up to 2.6% in June from a year earlier.
For investors, it’s normal for economic figures to point in slightly different directions, and even seem to contradict each other at times. This is sometimes due to economic uncertainty, and at other times due to measurement challenges. Regardless, it is the longer-term direction of the economy that really matters for investors, and using different data sources is key to understanding the bigger picture.
The bottom line? The latest jobs report has raised questions about whether government data can be trusted. Investors should understand both the benefits and limitations of this data. Looking at the broader picture based on a variety of data sources is the best way to make long-term investment decisions.
Winthrop Partners is an SEC-registered investment adviser. Registration does not imply a certain level of skill or training. The information provided is for informational purposes only and should not be considered investment, legal, or tax advice. All investments carry risks, including the possible loss of principal. No advice or recommendations are being provided in this advertisement, and you should consult a qualified professional before making any financial decisions. Past performance is not indicative of future results.
As a Chartered Financial Consultant at Winthrop Partners, Jennifer works closely with clients
and advisors in all areas of the financial planning process. On a daily basis, her key role is the
operations of the firm. With over 29 years of experience, she prides herself with providing
clients with a consistent high-quality experience when doing business with Winthrop Partners.